Repository navigation
A tour of the .NET Compiler SDK visualizer - #4579
Conversation


This commit addes the following:
1. Import syntax visualizer doc from roslyn-wiki: https://github.com/dotnet/roslyn/wiki/Syntax%20Visualizer
2. Add images.
3. provide include for installation instructions.
4. update index and TOC.
The existing text was written when the SDK was in preview mode. All screenshots have been updated. The text was updated for product names, formatted, and reviewed.

 BillWagner
changed the title

| > The following samples require the **.NET Compiler SDK** installed as part of Visual Studio 2017. You can find the .NET Compiler SDK as the last optional component listed under the **Visual Studio extension development** workload. The templates aren't installed without this component. | ||
|
|
||
| You can see the finished code for this sample in [our GitHub repository](https://github.com/dotnet/docs/tree/master/samples/csharp/roslyn-sdk/SemanticQuickStart). | ||
| You can see the finished code for this sample in [our GitHub repository](https://github.com/dotnet/samples/csharp/roslyn-sdk/SemanticQuickStart). |

There was a problem hiding this comment.
The link 404s. Must be
https://github.com/dotnet/docs/tree/master/samples/csharp/roslyn-sdk/SemanticQuickStart
|
|
||
| Pause typing once you have typed `Console.`. The tree has some items colored in pink. At this point, there are errors (also referred to as ‘Diagnostics’) in the typed code. These errors are attached to nodes, tokens, and trivia in the syntax tree. The visualizer shows you which items have errors attached to them highlighting the background in pink. You can inspect the errors on any item colored pink by hovering over the item. The visualizer will only display syntactic errors - those errors related to the syntax of the typed code – it will not display any semantic errors. | ||
|
|
||
| ## Syntax Graphs |
There was a problem hiding this comment.
I think this requires the DGML Editor
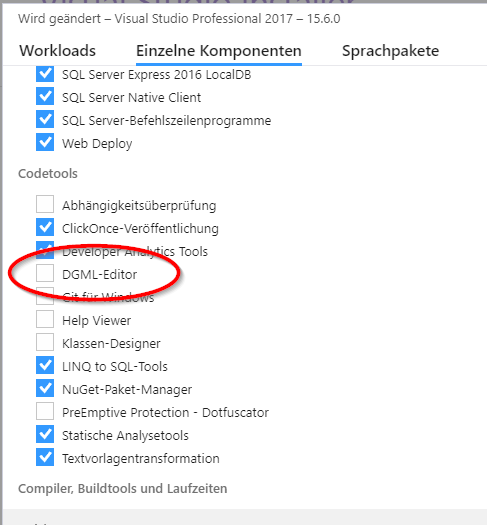
But I'm not sure. I don't have it installed and it doesn't shows the option View Directed Syntax Graph in the context menu.
There was a problem hiding this comment.
@MaStr11 What version of Visual Studio do you have? I don't see the DGML-Editor in the installer options.
@jinujoseph I'm currently looking at Visual Studio 15.6. Is the DGML Editor now always included?
There was a problem hiding this comment.
It's VS Professional 2017 15.6.0. The editor is listed on the Individual components page. I'm not certain if this component is really a/the requirement.
There was a problem hiding this comment.
Thanks! That was it.
Interestingly, the DGML component does not show up under any workload. You must use the "individual components" tab.

| - [Work with syntax](work-with-syntax.md) | ||
| - [Work with semantics](work-with-semantics.md) | ||
| - [Work with a workspace](work-with-workspace.md) | ||
| - [Explore code with the syntax visualizer](syntax-visualizer.md) |

There was a problem hiding this comment.
Why is the syntax visualizer listed twice here?
| --- | ||
| # Explore code with the syntax visualizer | ||
|
|
||
| This article provides an overview of the Syntax Visualizer tool that ships as part of the .NET Compiler Platform ("Roslyn") SDK. The Syntax Visualizer is a tool window that helps you inspect and explore syntax trees. It's an essential tool to understand the models for code you want to analyze. It's also a debugging aid when you develop your own applications using the .NET Compiler Platform (“Roslyn”) SDK. Open this tool as you create your first analyzers. The visualizer helps you understand the models used by the APIs. |
There was a problem hiding this comment.
Would it make sense to mention alternative ways of viewing the syntax tree, like SharpLab or LINQPad?
|
|
||
| ## Syntax Visualizer | ||
|
|
||
| The **Syntax Visualizer** enables inspection of the syntax tree for the C# or VB code file in the current active editor window inside the Visual Studio IDE. The visualizer can be launched by clicking on **View** –> **Other Windows** –> **Syntax Visualizer**. You can also use the **Quick Launch** toolbar in the upper right corner. Type "syntax" and the command to open the **Syntax Visualizer** should appear. |
There was a problem hiding this comment.
Nit: if you're already using Unicode en dash here, wouldn't it make sense to go the whole way and use Unicode right arrow (U+2192)? It would look like this:
View → Other Windows → Syntax Visualizer
The alternative is of course to use ASCII ->.
(I looked and the only current use of "en dash - greater than" was an error: #4644.)

There was a problem hiding this comment.
Or if you are typing it, →
|
|
||
| As shown in the preceding images, the visualizer tool window displays the syntax tree at the top and a property grid at the bottom. The property grid displays the properties of the item that is currently selected in the tree, including the .NET *Type* and the *Kind* (SyntaxKind) of the item. | ||
|
|
||
| Syntax trees comprise three types of items – *nodes*, *tokens*, and *trivia*. You can read more about these types in the [.NET Compiler Platform SDK Overview document](compiler-api-model.md). Items of each type are represented using a different color. Click on the button titled ‘Legend’ for an overview of the colors used. |
There was a problem hiding this comment.
The Overview does not explain what nodes, tokens and trivia are. Did you mean to link to work-with-syntax.md?
|
|
||
| The visualizer refreshes the tree to match modifications in the active code file. Add a call to `Console.WriteLine()` inside `Main()`. As you type, the visualizer refreshes the tree. | ||
|
|
||
| Pause typing once you have typed `Console.`. The tree has some items colored in pink. At this point, there are errors (also referred to as ‘Diagnostics’) in the typed code. These errors are attached to nodes, tokens, and trivia in the syntax tree. The visualizer shows you which items have errors attached to them highlighting the background in pink. You can inspect the errors on any item colored pink by hovering over the item. The visualizer will only display syntactic errors - those errors related to the syntax of the typed code – it will not display any semantic errors. |
There was a problem hiding this comment.
Nit: inconsistent use of dashes here: the opening dash is hyphen, the closing dash is en dash.
|
|
||
| Semantic inspection operations are only available on nodes. They are not available on tokens or trivia. Not all nodes have interesting semantic information to inspect. When a node doesn't have interesting semantic information, clicking on **View * Symbol (if any)** shows a blank property grid. | ||
|
|
||
| You can read more about APIs for performing semantic analysis in the [Work with semantics](work-with-semantics.md) overview documents. |
|
|
||
| You can read more about APIs for performing semantic analysis in the [Work with semantics](work-with-semantics.md) overview documents. | ||
|
|
||
| ## Closing and disabling syntax visualizer |
There was a problem hiding this comment.
Why is the section called "closing and disabling", if it only explains that you can close the visualizer?

 gewarren
left a comment
gewarren
left a comment
There was a problem hiding this comment.
I left some comments. Also as a general comment about the screenshots, we are supposed to use a thin grey border around screenshots that have white around the edges. Also, we are supposed to use a red box to highlight things within the screenshot. See this.
| @@ -0,0 +1,138 @@ | |||
| --- | |||
| title: Explore code with the syntax visualizer | |||
There was a problem hiding this comment.
For SEO, something like "explore code with the Roslyn syntax visualizer in Visual Studio".
|
|
||
| This article provides an overview of the Syntax Visualizer tool that ships as part of the .NET Compiler Platform ("Roslyn") SDK. The Syntax Visualizer is a tool window that helps you inspect and explore syntax trees. It's an essential tool to understand the models for code you want to analyze. It's also a debugging aid when you develop your own applications using the .NET Compiler Platform (“Roslyn”) SDK. Open this tool as you create your first analyzers. The visualizer helps you understand the models used by the APIs. | ||
|
|
||
| [!INCLUDE[interactive-note](~/includes/roslyn-installation.md)] |
There was a problem hiding this comment.
These instructions aren't correct. It tells you to choose the 'individual components' tab, but then it tells you to choose a workload. It should either say, choose the extension development workload (from the workloads tab) and then select the .NET complier platform SDK component in the summary pane on the right. Or it should say, choose the .NET compiler platform SDK component on the individual components tab (it's under the "Compilers, build tools, and runtimes" category). Sidenote: one could argue it is actually in the wrong category - perhaps it should be under the last category which is SDKs, libraries, and frameworks.
There was a problem hiding this comment.
I also updated the include to add the DGML editor, and removed the note about that in this article.
|
|
||
| ## Syntax Visualizer | ||
|
|
||
| The **Syntax Visualizer** enables inspection of the syntax tree for the C# or VB code file in the current active editor window inside the Visual Studio IDE. The visualizer can be launched by clicking on **View** –> **Other Windows** –> **Syntax Visualizer**. You can also use the **Quick Launch** toolbar in the upper right corner. Type "syntax" and the command to open the **Syntax Visualizer** should appear. |
There was a problem hiding this comment.
We are supposed to use the greater than sign (>) for successive menu choices (e.g. View > Other Windows > etc.).
|
|
||
| Dock this tool window at a convenient location inside Visual Studio, such as the left side. The Visualizer shows information about the current code file. | ||
|
|
||
| Create a new project using the **File** –> **New Project** command. You can create either a VB or C# project. When Visual Studio opens the main code file for this project, the visualizer displays the syntax tree for it. You can open any existing C# / VB file in this Visual Studio instance, and the visualizer displays that file's syntax tree. If you have multiple code files open inside Visual Studio, the visualizer will always display the syntax tree for the currently active code file, the code file that has keyboard focus. |
There was a problem hiding this comment.
Acrolinx will tell you to use the present tense where possible, i.e. "the visualizer displays the syntax tree for..."
There was a problem hiding this comment.
Hmm. I thought I'd run acronlinx on this. Ran it again to find other issues....
|
|
||
| Each item in the tree also displays its own **span**. The **span** is the indices of that node in the text file. In the preceding C# example, the selected “UsingKeyword [0..5)” token has a **Span** that is 5 characters wide, [0..5). The "[..)" notation means that the starting index is part of the span, but the ending index is not. | ||
|
|
||
| There are two ways two navigate the tree: |
|
|
||
| There are two ways two navigate the tree: | ||
| * Expand or click on items in the tree. The visualizer automatically selects the text corresponding to this item’s Span in the code editor. | ||
| * Clicking or Select text in the code editor. In the preceding VB example, if you select the line containing "Module Module1" in the code editor, the visualizer automatically navigates to the corresponding ModuleStatement node in the tree. |
There was a problem hiding this comment.
*Click or select text (i.e. keep tense and capitalization consistent)
|
|
||
| The visualizer refreshes the tree to match modifications in the active code file. Add a call to `Console.WriteLine()` inside `Main()`. As you type, the visualizer refreshes the tree. | ||
|
|
||
| Pause typing once you have typed `Console.`. The tree has some items colored in pink. At this point, there are errors (also referred to as ‘Diagnostics’) in the typed code. These errors are attached to nodes, tokens, and trivia in the syntax tree. The visualizer shows you which items have errors attached to them highlighting the background in pink. You can inspect the errors on any item colored pink by hovering over the item. The visualizer will only display syntactic errors - those errors related to the syntax of the typed code – it will not display any semantic errors. |
There was a problem hiding this comment.
*the visualizer only displays syntactic errors [...] it does not display any semantic errors.

|
@mairaw This one is ready to go. |

 rpetrusha
left a comment
rpetrusha
left a comment
There was a problem hiding this comment.
I left a number of comments, @BillWagner; you can choose which you want to address. The major comments concern using tabs to segregate C# and VB content. I'd highly recommend doing it, though not until after this PR is merged.
| - [Work with syntax](work-with-syntax.md) | ||
| - [Work with semantics](work-with-semantics.md) | ||
| - [Work with a workspace](work-with-workspace.md) | ||
| - [Explore code with the syntax visualizer](syntax-visualizer.md) |
|
|
||
| ## Syntax Visualizer | ||
|
|
||
| The **Syntax Visualizer** enables inspection of the syntax tree for the C# or VB code file in the current active editor window inside the Visual Studio IDE. The visualizer can be launched by clicking on **View** > **Other Windows** > **Syntax Visualizer**. You can also use the **Quick Launch** toolbar in the upper right corner. Type "syntax" and the command to open the **Syntax Visualizer** should appear. |
|
|
||
| Dock this tool window at a convenient location inside Visual Studio, such as the left side. The Visualizer shows information about the current code file. | ||
|
|
||
| Create a new project using the **File** > **New Project** command. You can create either a VB or C# project. When Visual Studio opens the main code file for this project, the visualizer displays the syntax tree for it. You can open any existing C# / VB file in this Visual Studio instance, and the visualizer displays that file's syntax tree. If you have multiple code files open inside Visual Studio, the visualizer displays the syntax tree for the currently active code file, the code file that has keyboard focus. |
There was a problem hiding this comment.
nit: "the code file that has keyboard focus" is best in parens.
|
|
||
| As shown in the preceding images, the visualizer tool window displays the syntax tree at the top and a property grid at the bottom. The property grid displays the properties of the item that is currently selected in the tree, including the .NET *Type* and the *Kind* (SyntaxKind) of the item. | ||
|
|
||
| Syntax trees comprise three types of items – *nodes*, *tokens*, and *trivia*. You can read more about these types in the [Work with syntax](work-with-syntax.md) article. Items of each type are represented using a different color. Click on the button titled ‘Legend’ for an overview of the colors used. |
There was a problem hiding this comment.
better: button titled 'Legend' --> Legend button
|
|
||
| Create a new project using the **File** > **New Project** command. You can create either a VB or C# project. When Visual Studio opens the main code file for this project, the visualizer displays the syntax tree for it. You can open any existing C# / VB file in this Visual Studio instance, and the visualizer displays that file's syntax tree. If you have multiple code files open inside Visual Studio, the visualizer displays the syntax tree for the currently active code file, the code file that has keyboard focus. | ||
|
|
||
|  |
There was a problem hiding this comment.
Should you use tabs here?
|
|
||
|  | ||
|
|
||
| The preceding example can also be replicated in VB. Type `Dim x As Double = 1 + 1` in a VB file. Select the expression `1 + 1` in the code editor window. The visualizer highlights the corresponding **AddExpression** node in the visualizer. Repeat the preceding steps for this **AddExpression** and you should see identical results. |
There was a problem hiding this comment.
With tabs, each could be in its own tab.
| End Module | ||
| ``` | ||
|
|
||
| This code introduces an alias named `C` that maps to the type `System.Console` at the top of the file and uses this alias inside `Main()`. Select the use of this alias, the `C` in `C.WriteLine()`, inside the method. The visualizer selects the corresponding **IdentifierName** node in the visualizer. Right-click this node and click on **View Symbol (if any)**. The property grid indicates that this identifier is bound to the type `System.Console` as shown in the following figure: |
There was a problem hiding this comment.
inside the method --> inside the `Main` method
|
|
||
|  | ||
|
|
||
| Inspect the symbol corresponding to any declared type, method, property, and more. Select the corresponding node in the visualizer and click on **View Symbol (if any)**. Select the method `Sub Main()`, including the body of the method. Click on **View Symbol (if any)** for the corresponding **SubBlock** node in the visualizer. The property grid shows the **MethodSymbol** for this **SubBlock** has name `Main` with return type `Void`. |
There was a problem hiding this comment.
"and more" seems out of -place. Just a period after property?
Since void isn't a VB term, just in case, explain that Void means no return value
|
|
||
|  | ||
|
|
||
| The above VB examples can be easily replicated in C#. Type `using C = System.Console;` in place of `Imports C = System.Console` for the alias. The preceding steps in C# yields identical results in the visualizer window. |
|
|
||
| There are two different ways to find the **.NET Compiler Platform SDK** in the **Visual Studio Installer**: | ||
|
|
||
| Install using the **Workloads** view: |
There was a problem hiding this comment.
I think I'd do this as level-3 head, and change the "You can also install using..." to "Install using the Individual Components tab" as a level-3 head. Otherwise, the structure of this section seems unclear.

| 1. Select the **Individual components** tab | ||
| 1. Check the box for **.NET Compiler Platform SDK**. You'll find it last under the **Compilers, build tools ,and runtimes** section. | ||
|
|
||
| Optionally, you'll also want the **DGML editor** to display graphs in the visualizer: |
There was a problem hiding this comment.
Sorry for being late but it seems that this is the wrong option
The issue mentions Code map is the right choice but maybe it's both. I haven't tested either.
There was a problem hiding this comment.
@MaStr11 Thanks for pointing this out. I did experiments, and only the DGML editor is needed. The Code Map feature depends on the DGML editor, so that will work too.
|  | ||
| --- | ||
|
|
||
| As shown in the preceding images, the visualizer tool window displays the syntax tree at the top and a property grid at the bottom. The property grid displays the properties of the item that is currently selected in the tree, including the .NET *Type* and the *Kind* (SyntaxKind) of the item. |
There was a problem hiding this comment.
There is something broken with the tab. The text starting with "As shown in preceding.." isn't shown if you open the C# tab. It is only visible if you open the VB tab:
visual-basic
csharp


Fixes dotnet/Roslyn-api-docs#36
Incorporate the content from the Roslyn Wiki for the Syntax Visualizer
Update screenshots, update the text, and add to the .NET Compiler SDK section of docs.
/cc @jinujoseph @mavasani @MaStr11 @gewarren
Internal review link