In this example: https://github.com/NPellet/jsGraph/blob/master/examples/v2/other/manyannotations.js I don't know how to specify that the axis should be a time series. Currently it displays 'false' on the axis 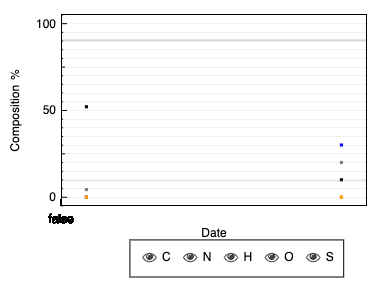


In this example:
https://github.com/NPellet/jsGraph/blob/master/examples/v2/other/manyannotations.js
I don't know how to specify that the axis should be a time series. Currently it displays 'false' on the axis