
Fig.1: GMSM Prototype
The framework has been evaluated by the SDN emulator "Mininet": http://mininet.org/ with POX as a network operating system (controller): https://github.com/noxrepo/pox/
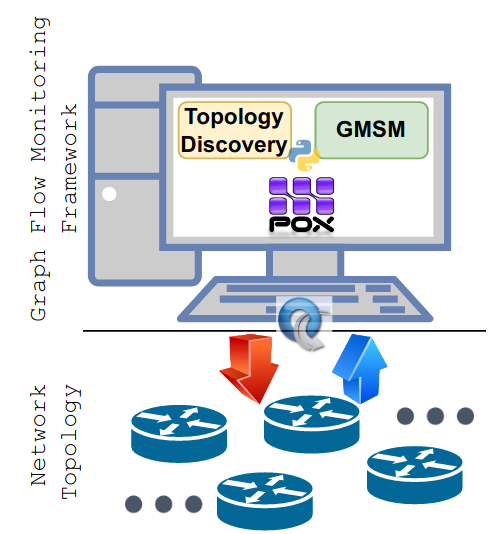
Fig.2: GMSM Framework
The network is modelled as an undirected graph G(V,E) by using the NetworkX tool, https://networkx.github.io/. To represent the data plane topology, Abilene network topology has been adopted from http://sndlib.zib.de/home.action. 6 clients are added to generate traffic and represent different class of services.
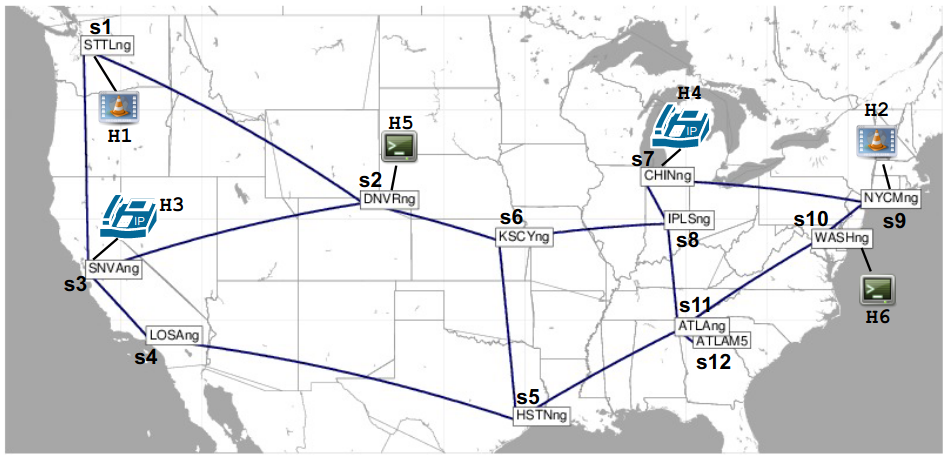
Fig.3: Abilene Topology
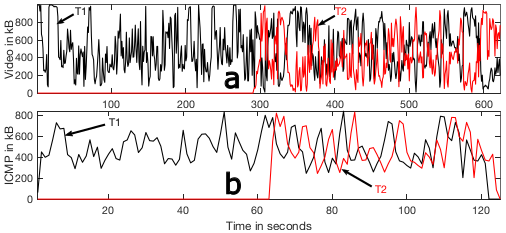
Fig.4: Evaluation of two different CoS flows: video and ICMP. Information is captured from the {s 2 , s 6 } link of the Abilene topology. The channel capacity is 8Mbps. The video and ICMP flows traverse a common path (s 1 , s 2 , s 6 , s 8 , s 7 , s 9 ).
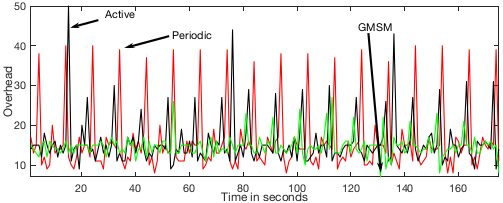
Fig.5: Network overhead measurement: the total number of invoked OpenFlow messages are: 2578, 2735 and 2764 messages for GMSM, active-flow and periodic monitoring respectively.
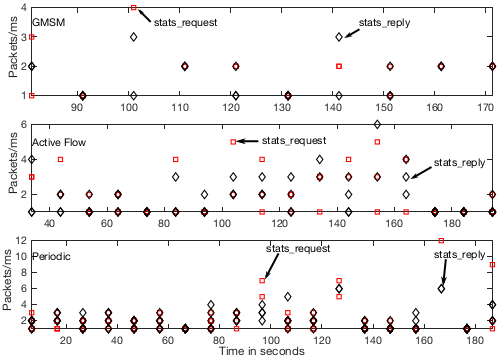
Fig.6: The count of OpenFlow stats request/reply packets per 1ms versus time are illustrated when the monitoring function is set at 10s intervals for GMSM, Active Flow and Periodic Monitoring. The □ represents the stats request and ♢ represents stats reply.

Fig.7: Number of switches used in monitoring: GMSM queries the smallest number of switches vs periodic and active monitoring.
- `If you use this framework or any of its code in your work then, please cite our IEEE Access publication:
+ A.Malik,R.de Fréin,"Graph Modeling for OpenFlow Switch Monitoring",IEEE Access,vol.11,p.84543-84553,2023" `